

- Reacting to down markets is a good way to derail progress made toward reaching your financial goals
- Over the past century, US stocks have averaged positive returns over one-year, three-year, and five-year periods following a steep decline.
- One of the best ways to avoid succumbing to emotion at the expense of your portfolio is to partner with an advisor and make a plan.
Investors can always expect uncertainty. While volatile periods like the one we’re experiencing now can be intense, investors who learn to embrace uncertainty may often triumph in the long run. Reacting to down markets is a good way to derail progress made toward reaching your financial goals. Here are three lessons to keep in mind during periods of volatility that can help you stick to your well-built plan. And if you don’t have a plan, there’s a suggestion for that too.
1. A RECESSION IS NOT A REASON TO SELL
Are we headed into a recession? A century of economic cycles teaches us we may well be in one before economists make that call. But one of the best predictors of the economy is the stock market itself. Markets tend to fall in advance of recessions and start climbing earlier than the economy does. As the chart below shows, returns have often been positive while in a recession. In US dollars. Recessions shaded in green. Stock returns represented by Fama/French Total US Market Research Index, provided by Ken French and available at mba.tuck.dartmouth.edu/pages/faculty/ken.french/data_library.html.
This value-weighed US market index is constructed every month, using all issues listed on the NYSE, AMEX, or Nasdaq with available outstanding shares and valid prices for that month and the month before. Exclusions: American depositary receipts. Sources: CRSP for value-weighted US market return. Rebalancing: Monthly. Dividends: Reinvested in the paying company until the portfolio is rebalanced. Growth of wealth shows the growth of a hypothetical investment of $100 in the securities in the Fama/French US Total Market Research Index from July 1926 through December 2021.
In US dollars. Recessions shaded in green. Stock returns represented by Fama/French Total US Market Research Index, provided by Ken French and available at mba.tuck.dartmouth.edu/pages/faculty/ken.french/data_library.html.
This value-weighed US market index is constructed every month, using all issues listed on the NYSE, AMEX, or Nasdaq with available outstanding shares and valid prices for that month and the month before. Exclusions: American depositary receipts. Sources: CRSP for value-weighted US market return. Rebalancing: Monthly. Dividends: Reinvested in the paying company until the portfolio is rebalanced. Growth of wealth shows the growth of a hypothetical investment of $100 in the securities in the Fama/French US Total Market Research Index from July 1926 through December 2021.
All the dots in the upper left quadrant in the chart below are years where the US economy contracted but US stocks still outperformed less-risky Treasury bills. It’s a great illustration of the forward-looking nature of markets. If you’re worried, other investors are too, and that uncertainty is reflected in stock prices.
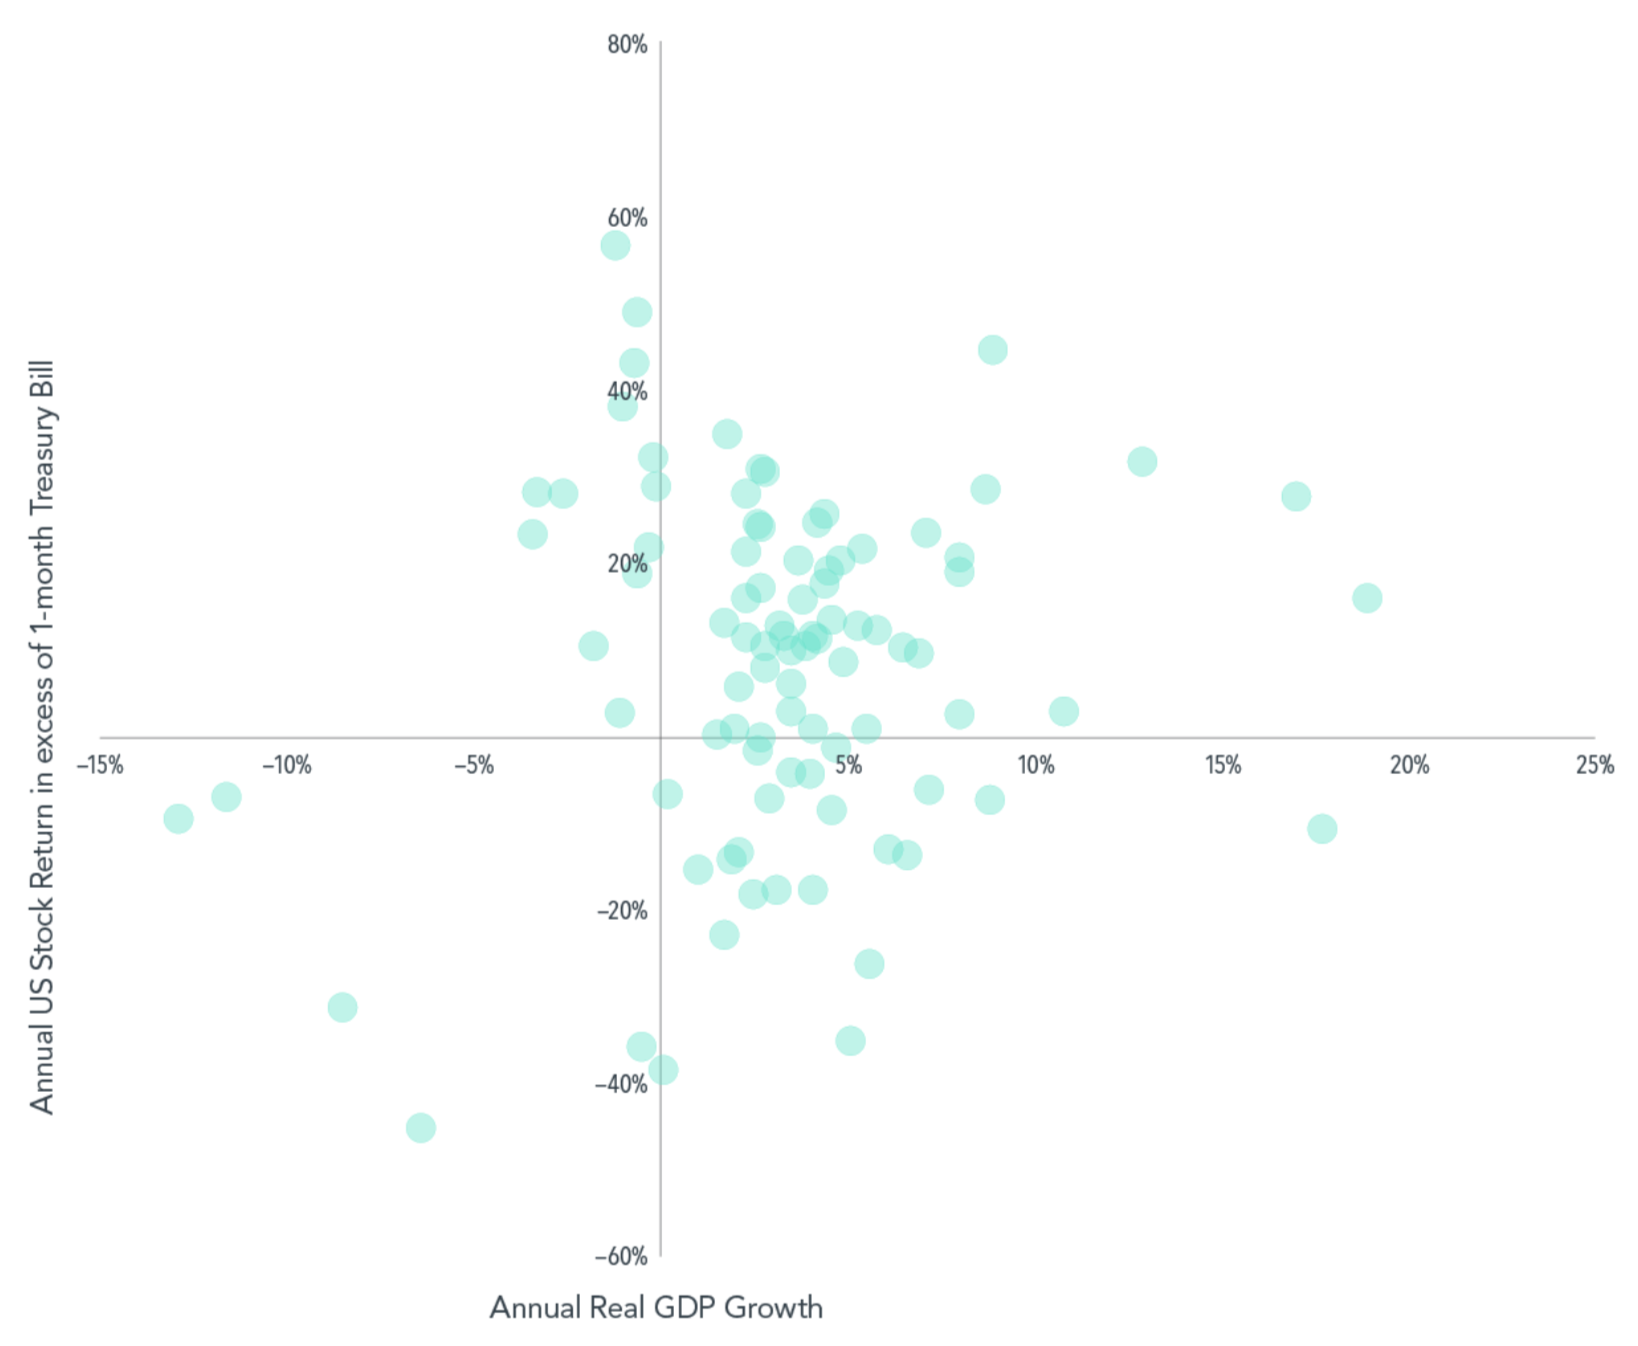 Indices are not available for direct investment. Their performance does not reflect the expenses associated with the management of an actual portfolio. In USD. Annual GDP growth rates obtained from the US Bureau of Economic Analysis. GDP growth numbers are adjusted to 2012 USD terms to remove the effects of inflation. Data provided by Fama/French. Eugene Fama and Ken French are members of the Board of Directors of the general partner of and provide consulting services to, Dimensional Fund Advisors LP. Please see “Appendix Descriptions” for a description of the Fama/French index data.
Results shown during periods prior to each index’s index inception date do not represent actual returns of the respective index. Other periods selected may have different results, including losses. Backtested index performance is hypothetical and is provided for informational purposes only to indicate historical performance had the index been calculated over the relevant time periods. Backtested performance results assume the reinvestment of dividends and capital gains.
Indices are not available for direct investment. Their performance does not reflect the expenses associated with the management of an actual portfolio. In USD. Annual GDP growth rates obtained from the US Bureau of Economic Analysis. GDP growth numbers are adjusted to 2012 USD terms to remove the effects of inflation. Data provided by Fama/French. Eugene Fama and Ken French are members of the Board of Directors of the general partner of and provide consulting services to, Dimensional Fund Advisors LP. Please see “Appendix Descriptions” for a description of the Fama/French index data.
Results shown during periods prior to each index’s index inception date do not represent actual returns of the respective index. Other periods selected may have different results, including losses. Backtested index performance is hypothetical and is provided for informational purposes only to indicate historical performance had the index been calculated over the relevant time periods. Backtested performance results assume the reinvestment of dividends and capital gains.
Whether accompanied by recessions or not, market downturns can be unsettling. But over the past century, US stocks have averaged positive returns over one-year, three-year, and five-year periods following a steep decline. A year after the S&P 500 crossed into bear market territory (a 20% fall from the market’s previous peak), it rebounded by about 20% on average. And after five years, the S&P 500 averaged returns over 70%. [S&P data © 2022 S&P Dow Jones Indices LLC, a division of S&P Global. All rights reserved. Indices are not available for direct investment.]
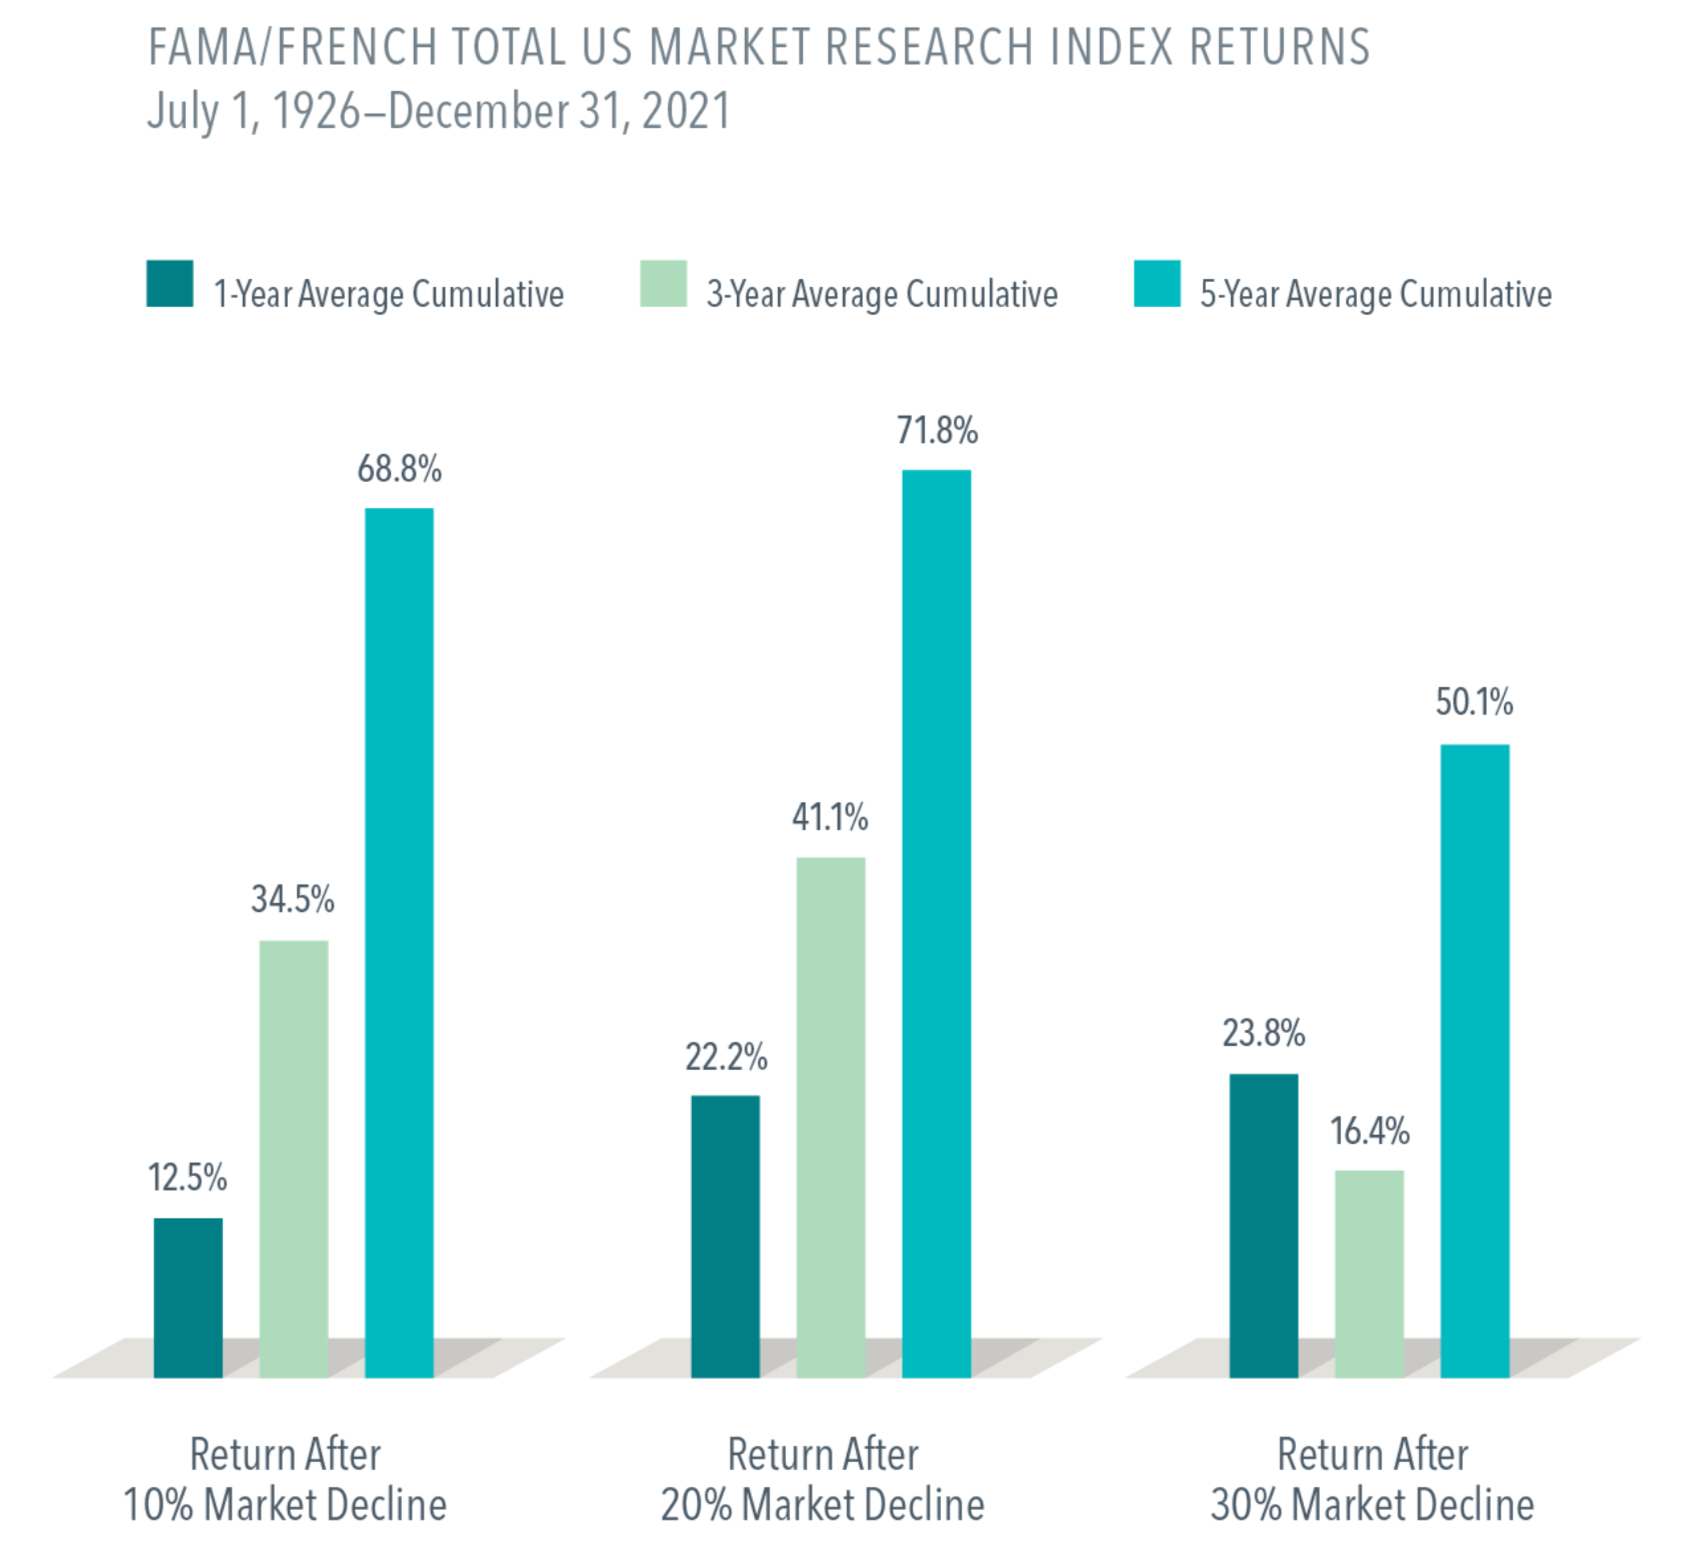 Market declines or downturns are defined as periods in which the cumulative return from a peak is -10%, -20%, or -30% or lower. Returns are calculated for the 1-, 3-, and 5-year look-ahead periods beginning the day after the respective downturn thresholds of -10%, -20%, or -30% are exceeded. The bar chart shows the average returns for the 1-, 3-, and 5-year periods following the 10%, 20%, and 30% thresholds. For the 10% threshold, there are 29 observations for 1-year look-ahead, 28 observations for 3-year look-ahead, and 27 observations for 5-year look-ahead. For the 20% threshold, there are 15 observations for 1-year look-ahead, 14 observations for 3-year look-ahead, and 13 observations for 5-year look-ahead. For the 30% threshold, there are 7 observations for 1-year look-ahead, 6 observations for 3-year look-ahead, and 6 observations for 5-year look-ahead. Peak is a new all-time high prior to a downturn. Data provided by Fama/French and available at mba.tuck.dartmouth.edu/pages/faculty/ken.french/data_library.html. Fama/French Total US Market Research
Index: 1926–present: Fama/French Total US Market Research Factor and One-Month US Treasury Bills. Source: Ken French website.
We believe that staying invested puts you in the best position to capture the recovery. If you take risk out of your portfolio, it should be a strategic, not tactical, choice. We believe the only good reason to sell out of a stock portfolio now—so long as it’s diversified and low-cost—is because you learned something about your risk tolerance or your investment goals have changed.
Market declines or downturns are defined as periods in which the cumulative return from a peak is -10%, -20%, or -30% or lower. Returns are calculated for the 1-, 3-, and 5-year look-ahead periods beginning the day after the respective downturn thresholds of -10%, -20%, or -30% are exceeded. The bar chart shows the average returns for the 1-, 3-, and 5-year periods following the 10%, 20%, and 30% thresholds. For the 10% threshold, there are 29 observations for 1-year look-ahead, 28 observations for 3-year look-ahead, and 27 observations for 5-year look-ahead. For the 20% threshold, there are 15 observations for 1-year look-ahead, 14 observations for 3-year look-ahead, and 13 observations for 5-year look-ahead. For the 30% threshold, there are 7 observations for 1-year look-ahead, 6 observations for 3-year look-ahead, and 6 observations for 5-year look-ahead. Peak is a new all-time high prior to a downturn. Data provided by Fama/French and available at mba.tuck.dartmouth.edu/pages/faculty/ken.french/data_library.html. Fama/French Total US Market Research
Index: 1926–present: Fama/French Total US Market Research Factor and One-Month US Treasury Bills. Source: Ken French website.
We believe that staying invested puts you in the best position to capture the recovery. If you take risk out of your portfolio, it should be a strategic, not tactical, choice. We believe the only good reason to sell out of a stock portfolio now—so long as it’s diversified and low-cost—is because you learned something about your risk tolerance or your investment goals have changed.